Buildings are the largest global contributor of greenhouse gas emissions. Heating, cooling and powering buildings release 28% of all global energy-related carbon emissions — making a total of 39% when you include materials and construction. Carbon and other greenhouse gas emissions trap the sun’s heat, leading to climate change and environmental catastrophe. Carbon gas emissions also contribute to the development of respiratory diseases and other health issues.

In the UK, around 17% of greenhouse gas emissions come from buildings. Despite improvements over recent decades, progress “remains broadly insufficient to ensure that the buildings sector reaches zero emissions by 2050,” according to the government’s independent advisers, the Climate Change Committee.
But the choices society makes continue to prioritise financial interests, with big building and renovation projects frequently greenwashed and eco laws circumvented. “It’s not the time to be neutral about the fate of the planet,” environmental lawyer Farhana Yamin told the RIBA Built Environment Summit, encouraging architects to work alongside businesses in building and maintaining more efficient buildings. “Our role is not just to service whatever clients want, it’s also to educate clients and educate ourselves.”
For our latest data study, Business Energy UK has calculated the average carbon emissions from residential, business and public premises in Britain’s biggest cities to see which cities have the most and least energy-efficient buildings.
What We Did
We used official energy certificate data for England, Wales and Scotland to determine the average CO2 emissions in kg/m2 per year for residential, commercial and public buildings in each city with a population over 100k. We then ranked these cities by their average emissions per square metre in each category and overall. Scottish cities were omitted from the public building and overall rankings as public building data was unavailable.
Key Findings
-
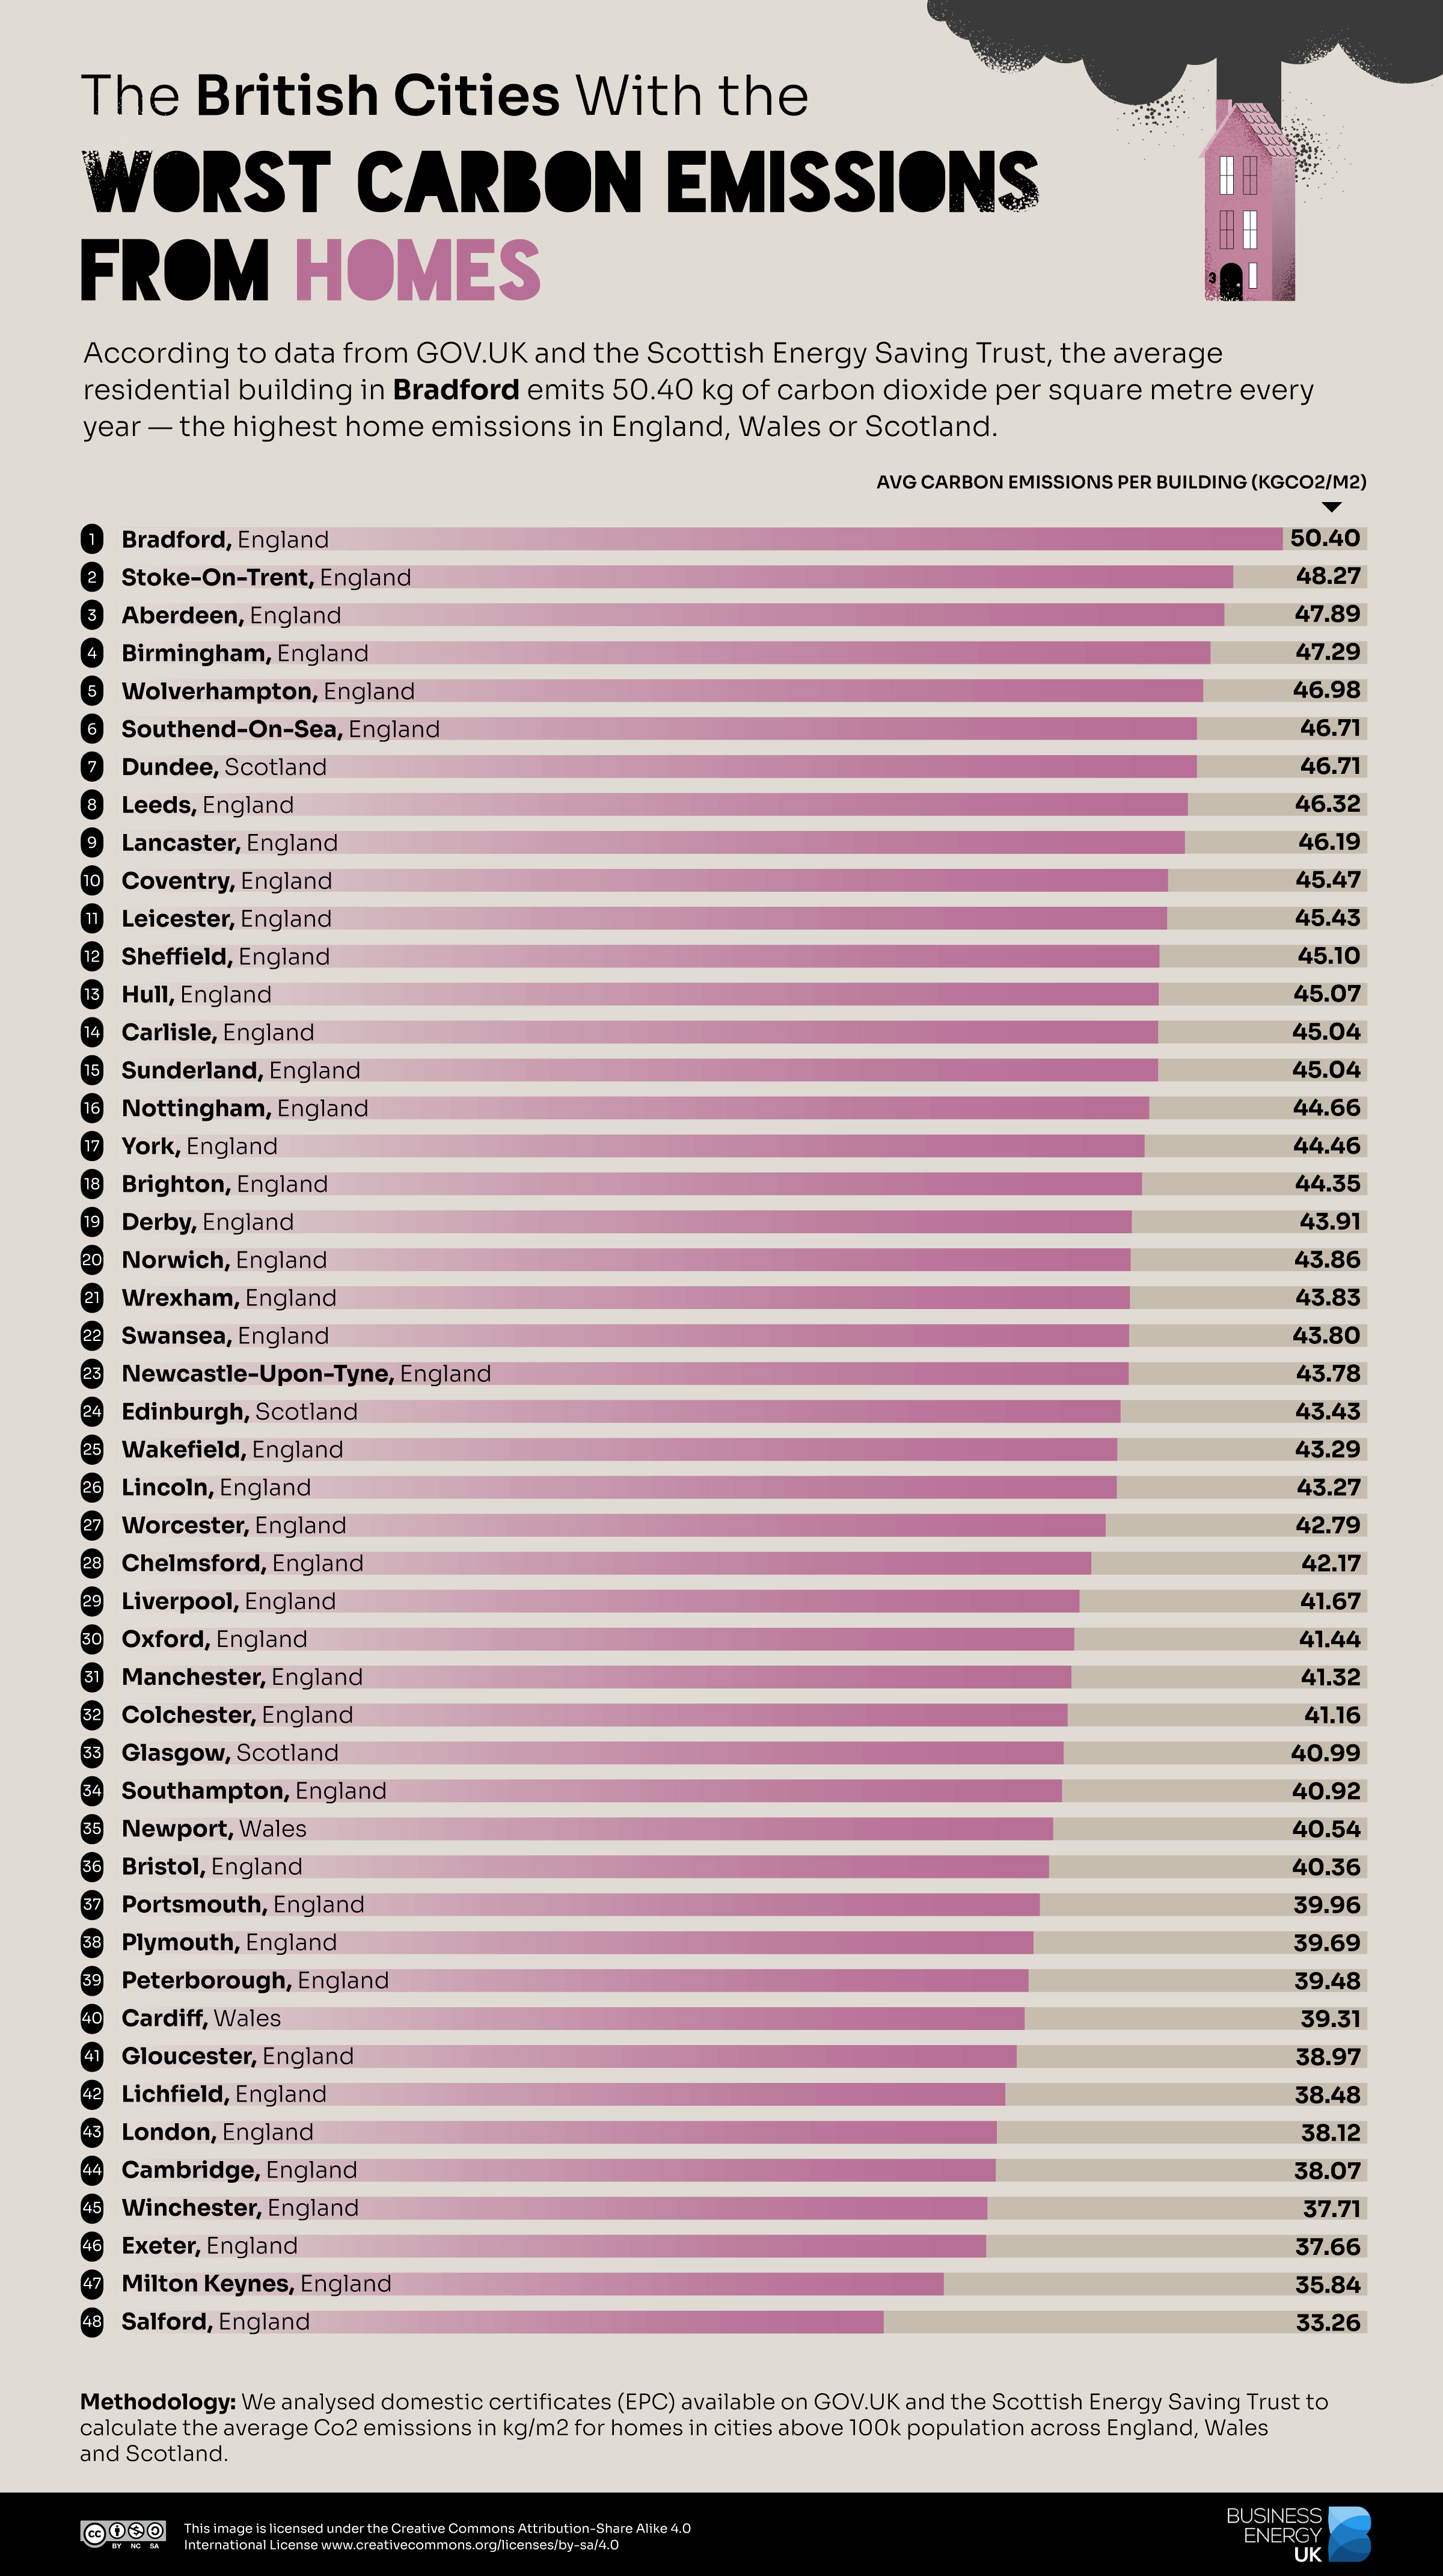
- Residential buildings in Bradford, West Yorkshire, have the highest carbon emissions in England, Wales or Scotland, with an average of 50.40 kgCO2e/m2.
-
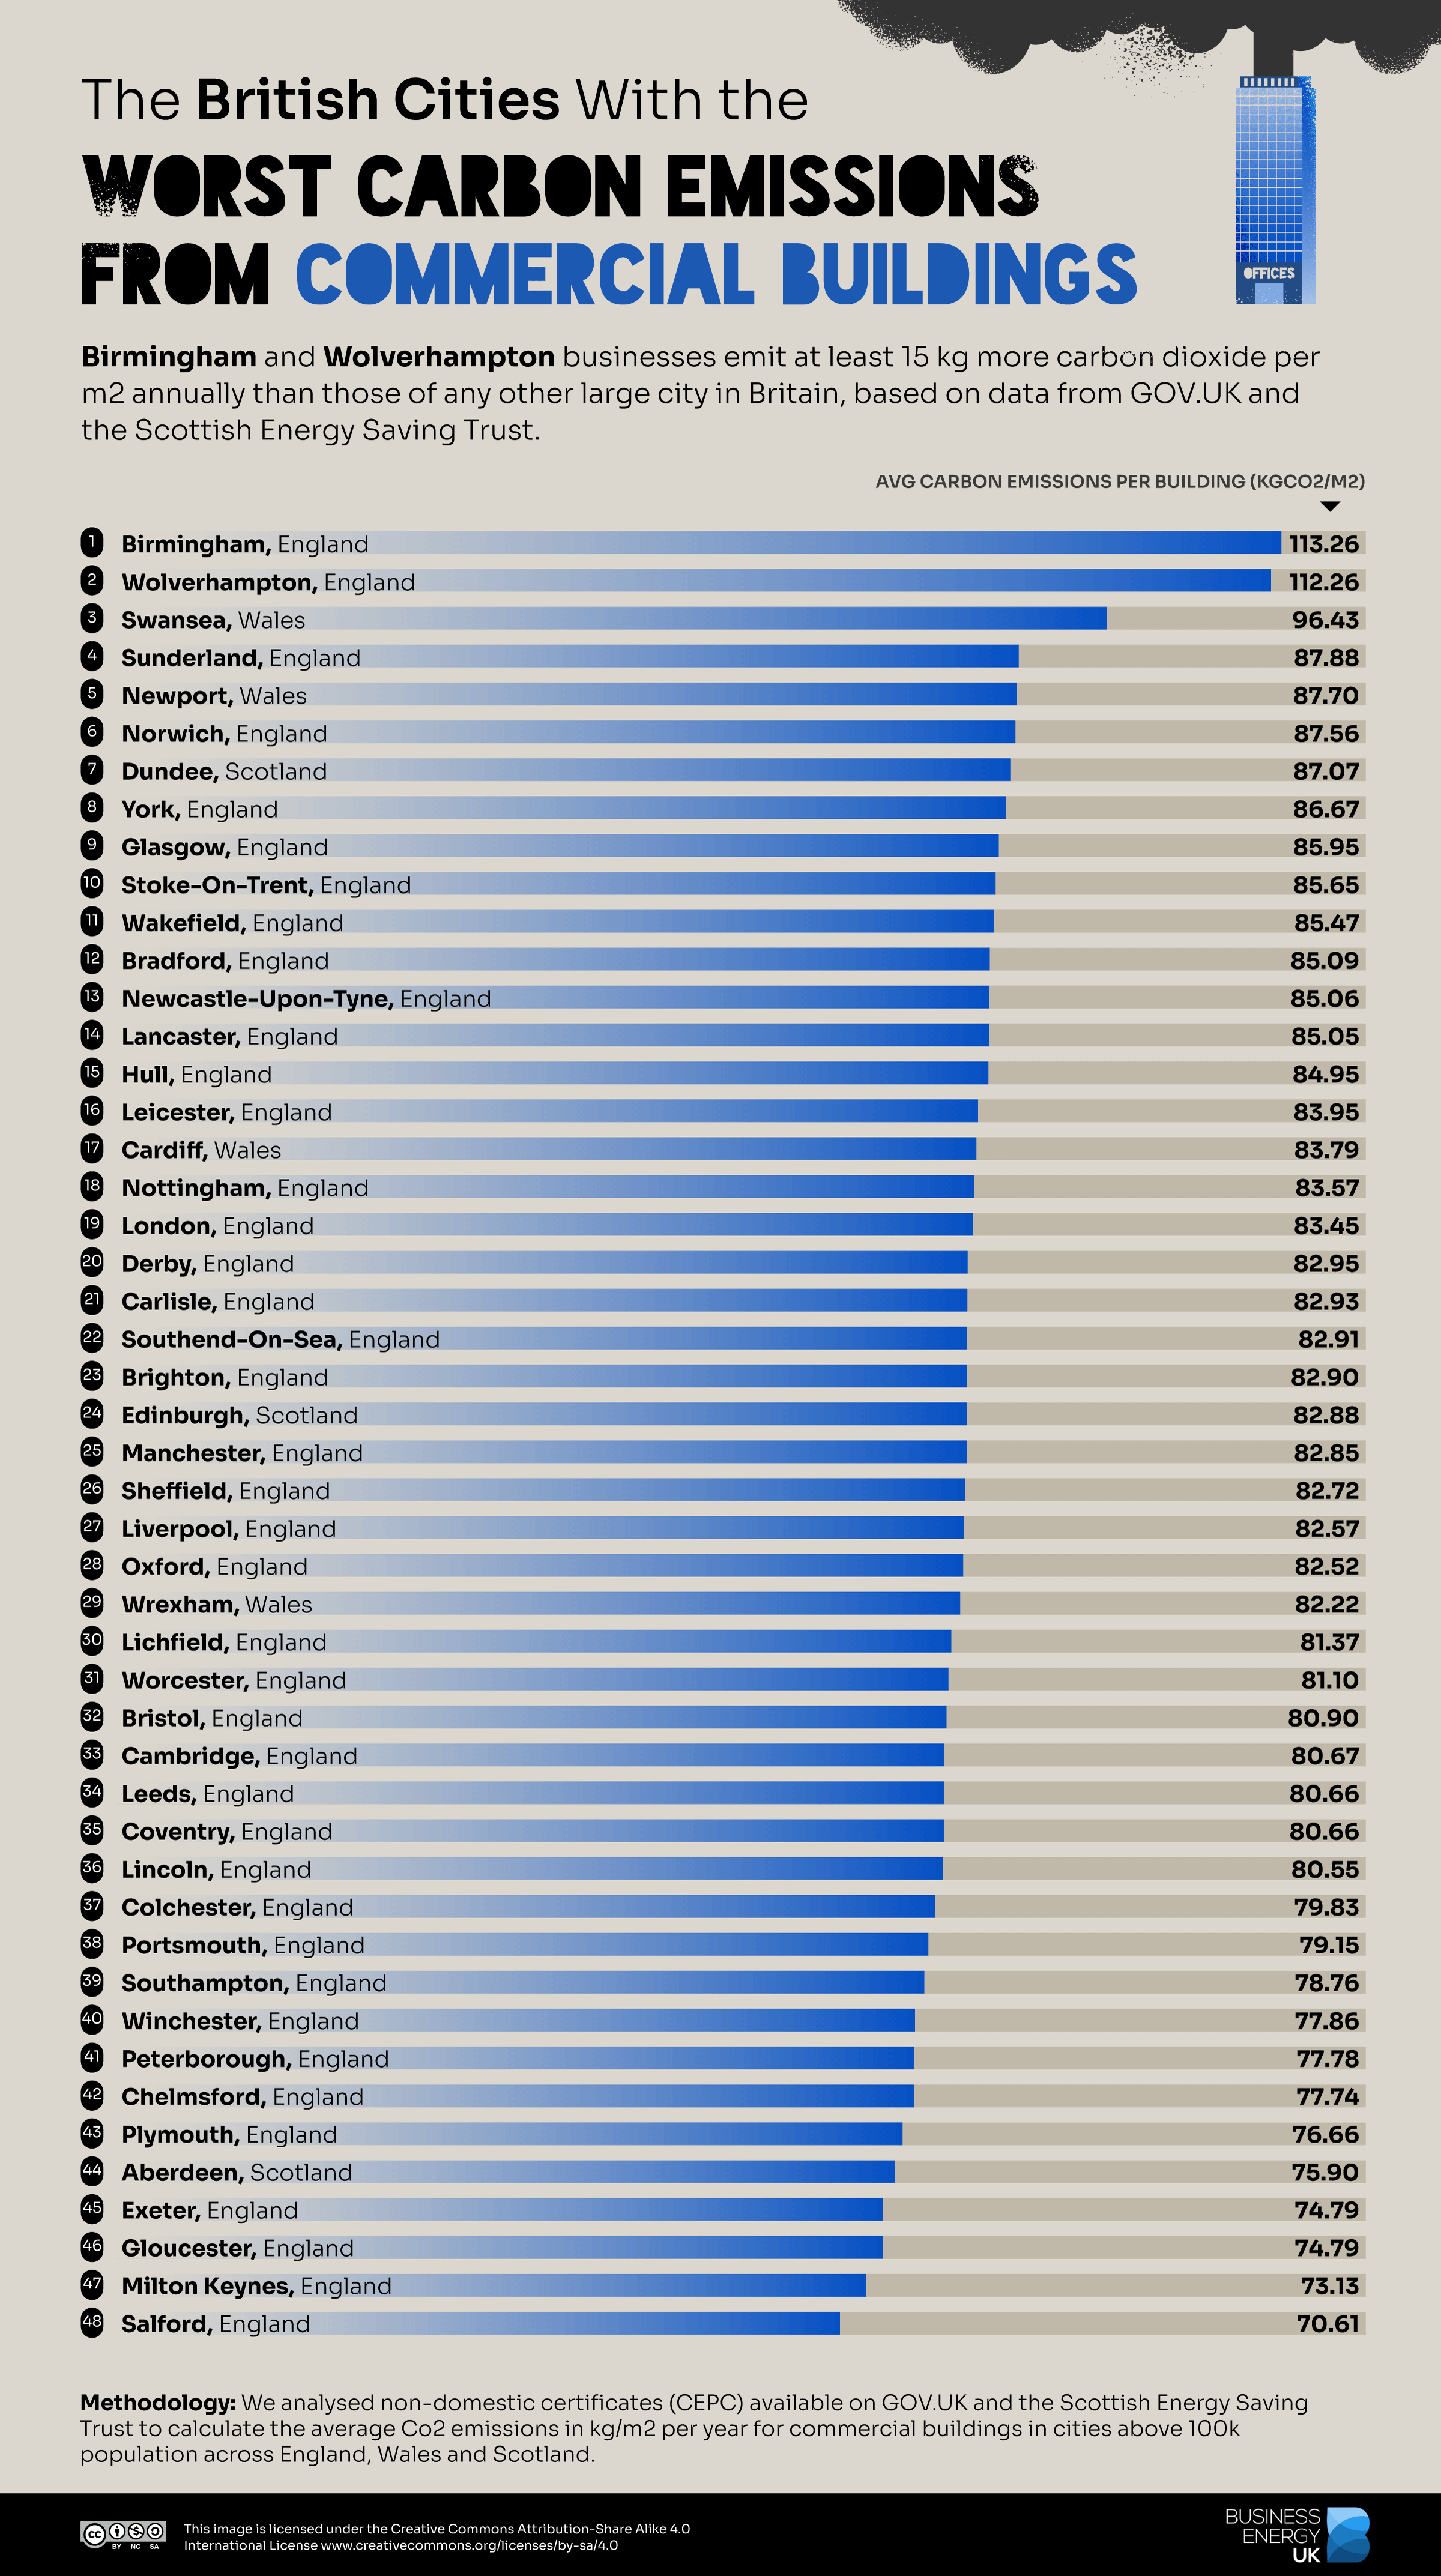
- Birmingham, West Midlands, has average commercial building emissions of 113.26 kgCO2e/m2 — the highest in England, Wales or Scotland.
-
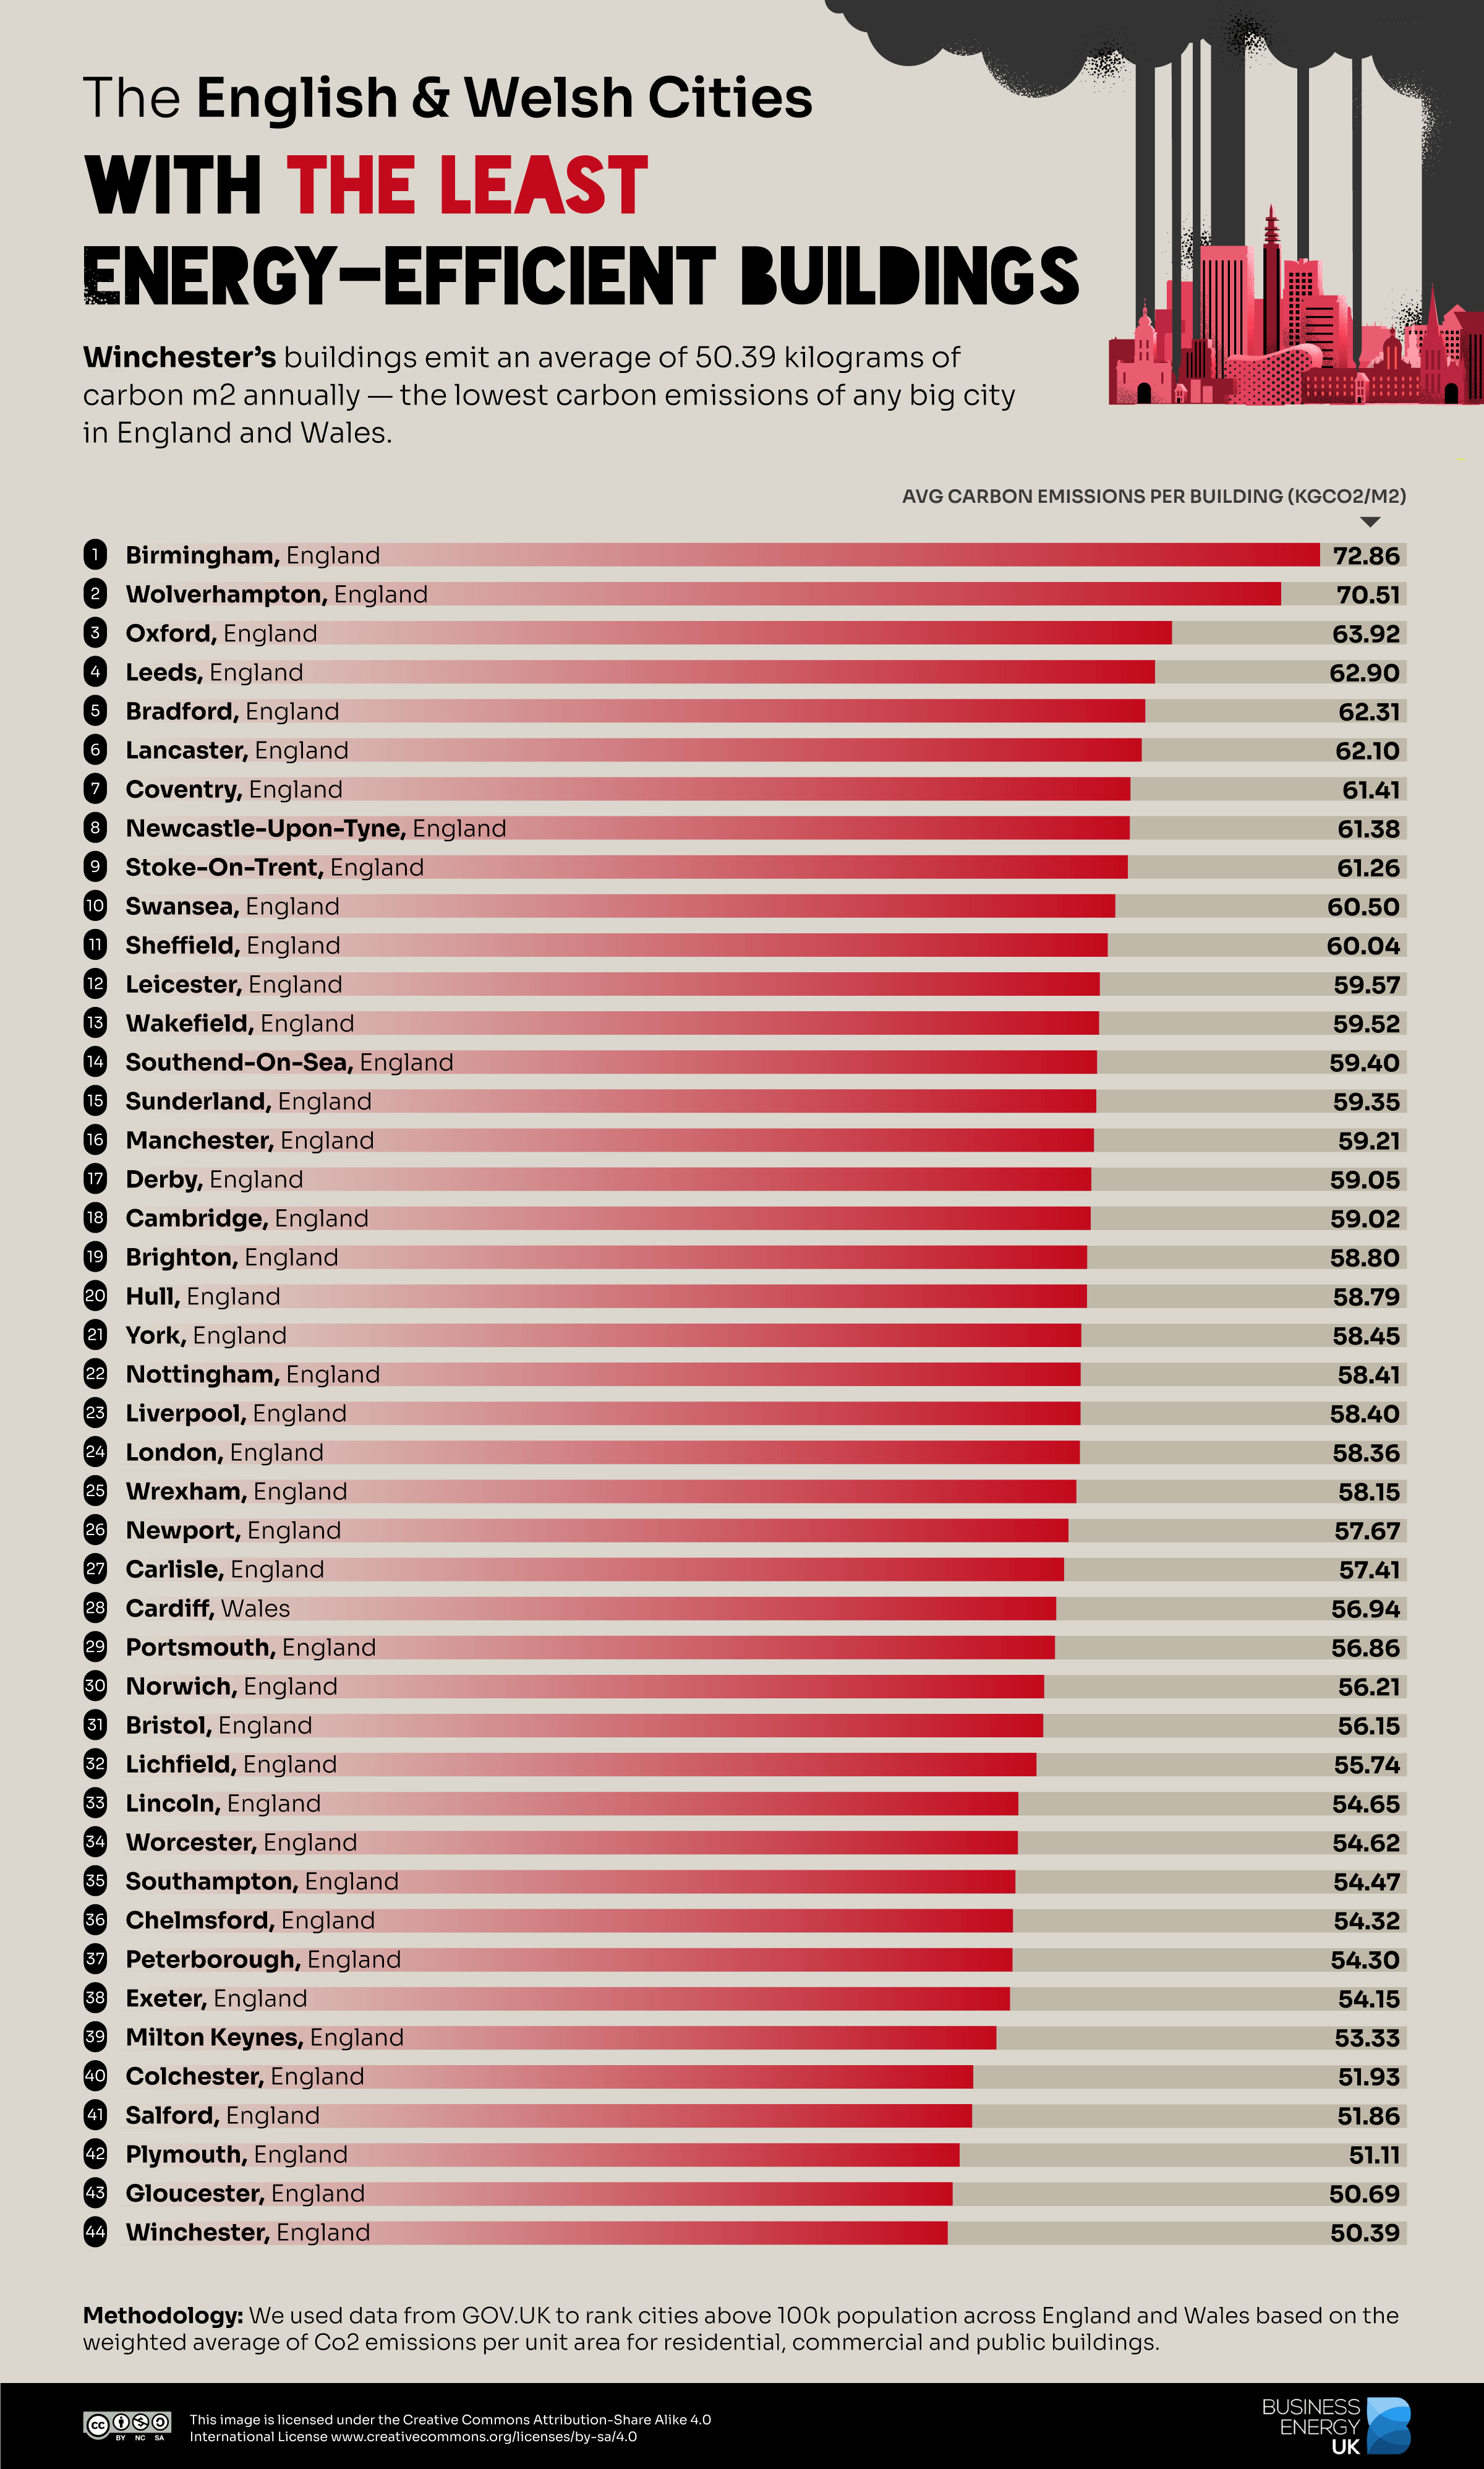
- Birmingham also has the highest overall emission in England or Wales, averaging 72.86 kgCO2e/m2 across categories.
-
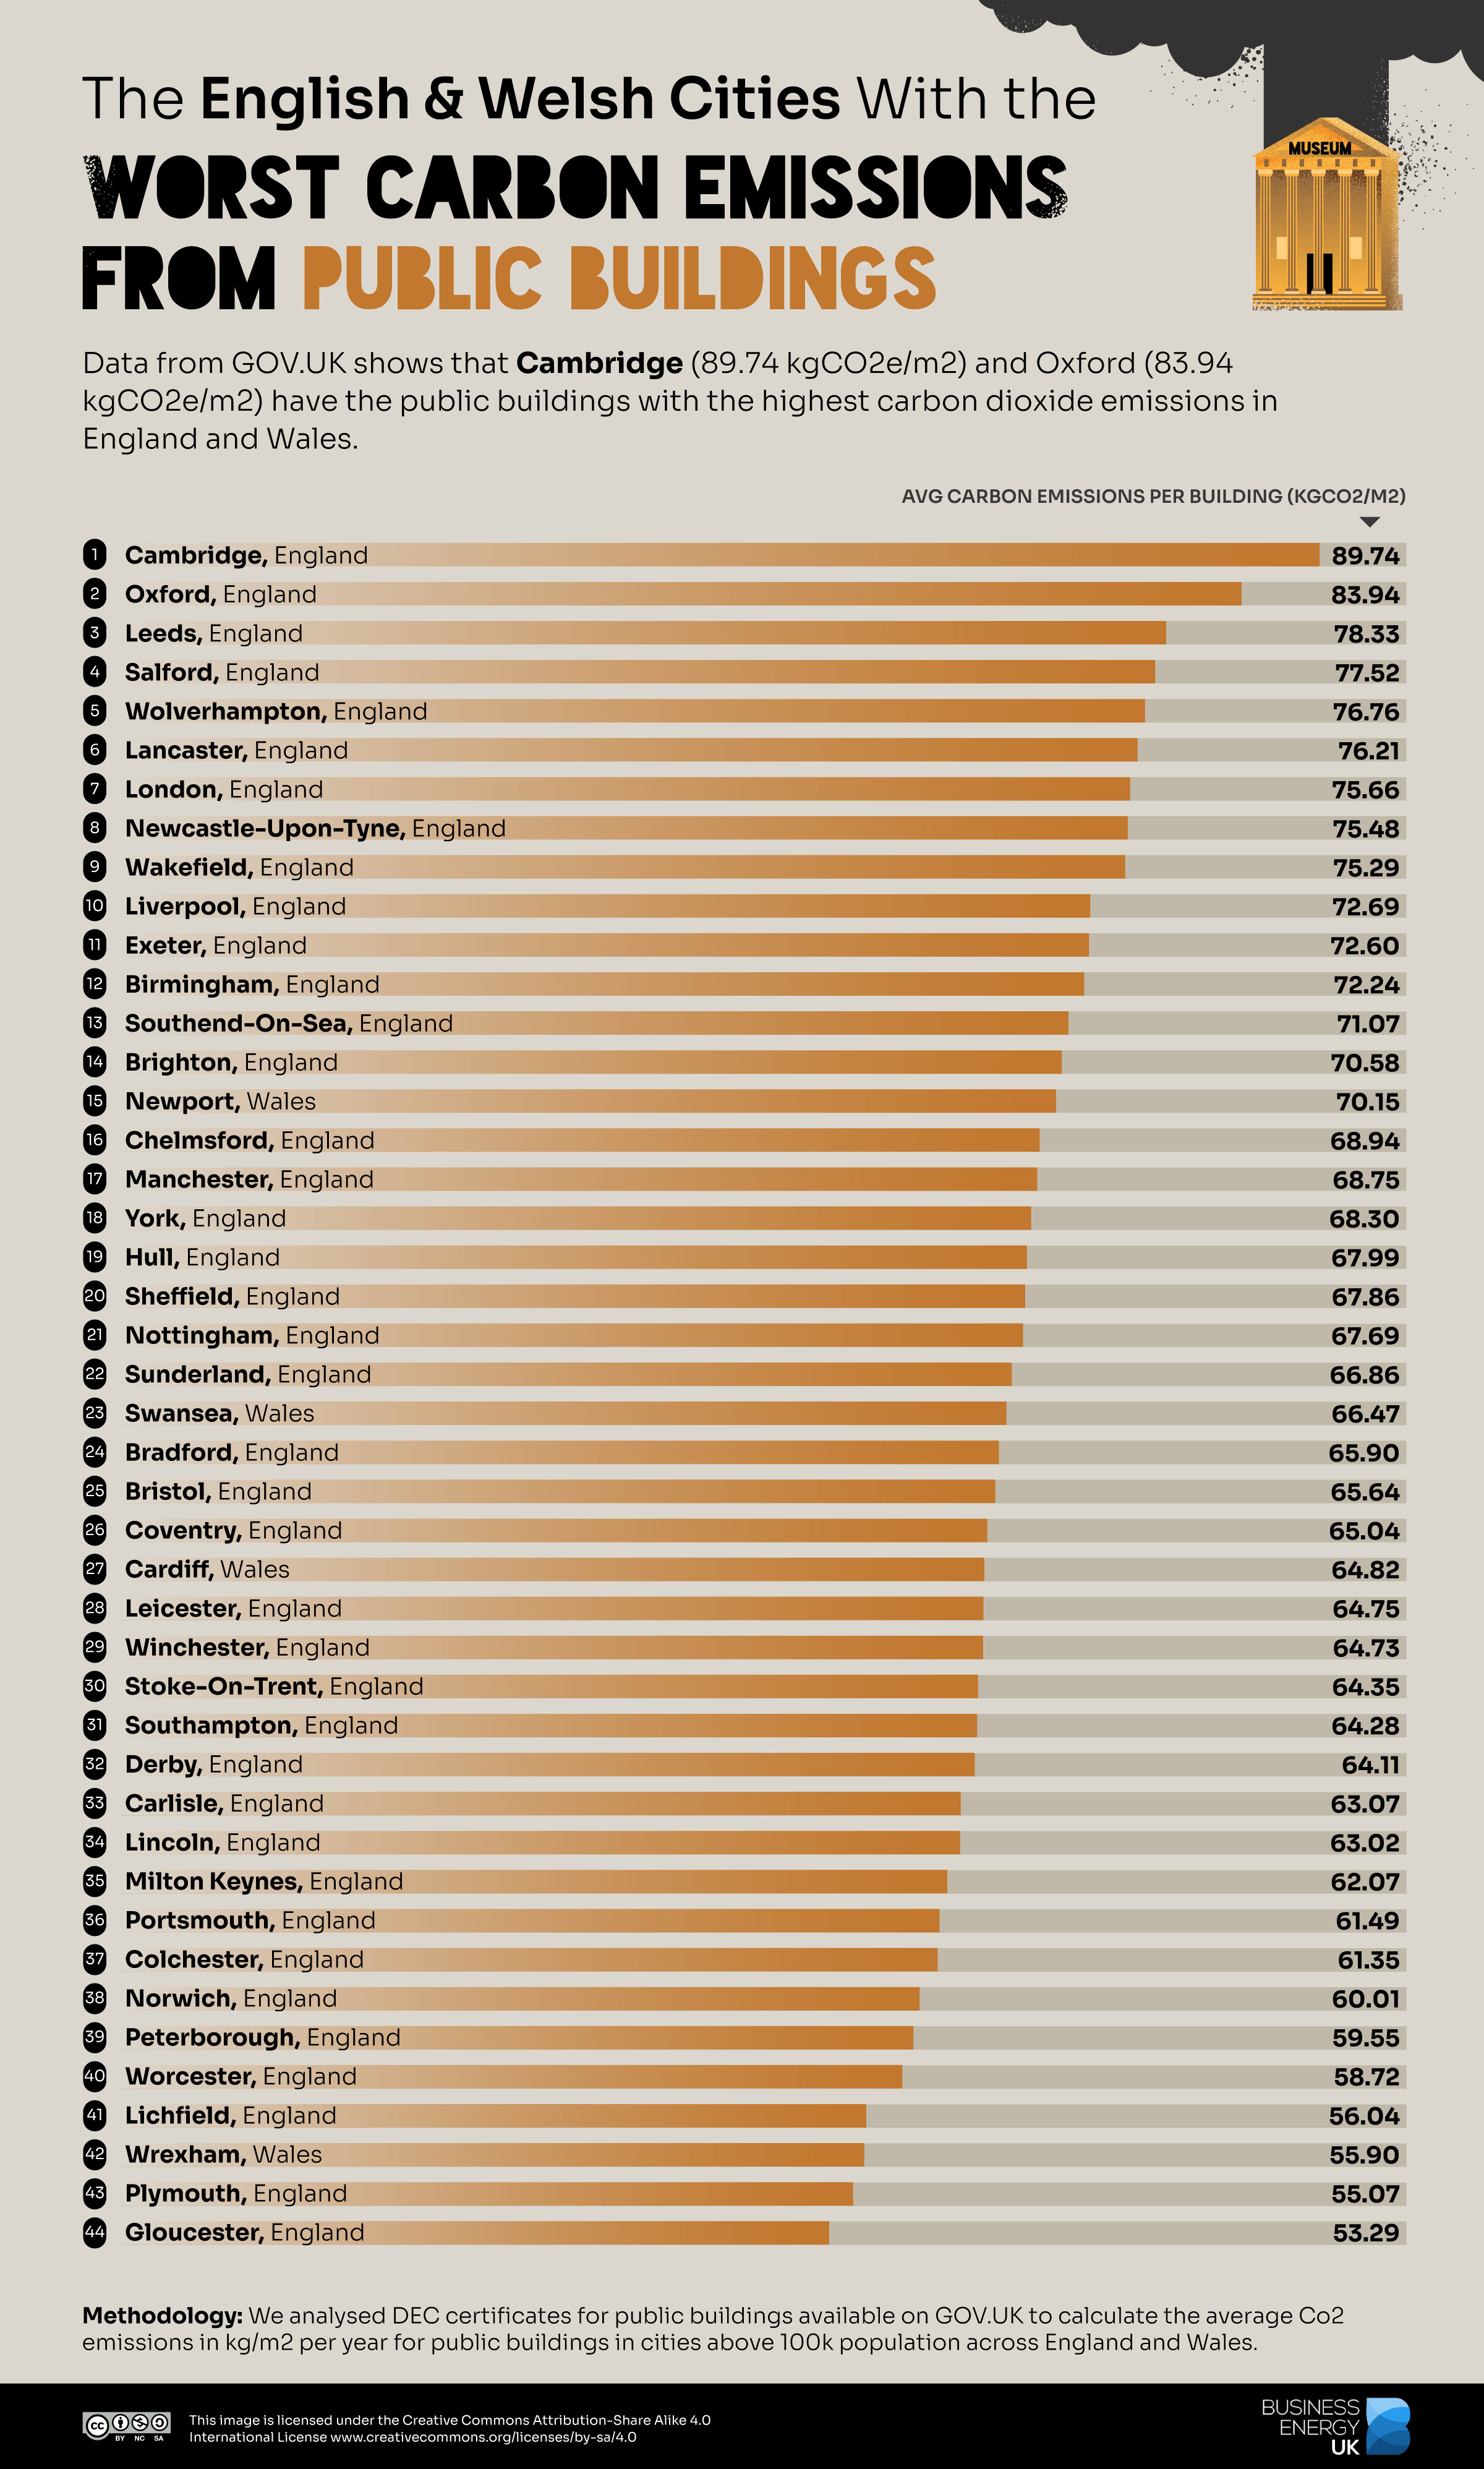
- Cambridge is the UK city with the worst emissions from public buildings, at an average of 89.74 kgCO2e/m2.
Salford has Britain’s Most Efficient City Homes
UK homes lose more heat on average than any of the nearest neighbouring countries. But in September 2023, the Tory government cancelled regulations requiring landlords to improve the energy efficiency of rental homes. In Bradford, West Yorkshire, the average residential building continues to emit 50.40 kgCO2e/m2 annually. Even among new builds, the energy required to heat the average Bradford home is up to 30% higher than in new homes in wealthier parts of the country.
Bradford’s inefficient homes impact local and global health and reinforce economic differences through higher bills. While today’s technologies could be used to cut 61% of building emissions by the UK’s net zero target of 2050, developers are making choices that affect this progress at every stage. “No one is questioning if the way they make money is aligned with their contribution to climate mitigation, says Yamina Saheb, author of a UN report on the Mitigation of Climate Change.

“Residential buildings undergo major renovation once every 25 years,” says Saheb. “That means if you’re not renovating a building to zero-emissions standards this decade, it will not be renovated to this level by 2050 either. For buildings, there is only one round left between now and 2050, so we either get this right or it’s wrong forever.” Salford is the most carbon-efficient big city for residential buildings. In Salford, substantial “eco-transformation” projects are revitalising social housing developments with the installation of ground source heating systems and improved insulation.
Birmingham and Wolverhampton Businesses Have Highest Emissions
For commercial buildings, we found Birmingham (113.26 kgCO2e/m2) and Wolverhampton (112.26 kgCO2e/m2) in the West Midlands to have significantly higher carbon emissions than any other large city. In Birmingham’s case, average commercial building emissions are 60.4% higher than in Salford and 35.7% higher than in London.

Birmingham’s iconic Ringway Centre office block has become a complex symbol of the effort to modernise the city. The block was designed to complement Birmingham’s then-progressive car-oriented vision in the 1960s but now blocks pedestrian traffic and has been approved for demolition. However, campaigners claim that retrofitting the building will protect the city’s heritage while minimising the environmental impact of reimagining the space.
As sustainable architect John Christophers notes, “By the developers’ own admission, 187 million kg CO2 would be released through demolition and building of these tower blocks, which is the same carbon emissions as an average UK car driving the whole way around the world 33,000 times.”
Cambridge and Oxford Public Buildings Are UK’s Least Efficient
The cities of Cambridge and Oxford are known for their celebrated universities and sprawling campuses. But the public buildings in these cities emit more carbon equivalent per square metre than any other large city in England or Wales. The average emissions in Cambridge are equal to 89.74 kgCO2e/m2 annually. Cambridgeshire County Council declared a Climate Emergency in February 2019, establishing a net zero plan to be reached by 2030.

Public sector buildings across the UK are subject to a plan to reduce emissions by 75% between 2017 and 2037. These buildings account for around 2% of total UK emissions. This year, the government announced £557 million in funding for public buildings and businesses to reduce their energy bills and carbon emissions. Presently, Gloucester (53.29 kgCO2e/m2) is the big city with the lowest emissions from public buildings. Gloucester City Council brought forward its net zero target from 2050 to 2045 due to growing confidence in its ability to meet the Intergovernmental Panel on Climate Change’s thresholds.
Leeds Among Worst Carbon Offenders Across Building Types
Finally, we ranked the overall worst cities for emissions in England and Wales for residential, commercial and public buildings (Scotland is omitted because figures aren’t available for public buildings). Birmingham and Wolverhampton again come out on top. Their commercial building emissions are so much higher than any other large city that they push the average across building categories to significantly higher levels than those elsewhere, too.

Leeds is the fourth worst city for carbon emissions across all categories. The West Yorkshire city performs particularly poorly for residential buildings (46.32 kgCO2e/m2) and public buildings (78.33 kgCO2e/m2), ranking eighth and third worst, respectively. Leeds aims to be net zero by 2050 and has even proposed to bring that date forward to 2030. The city has pledged to change the heating network, retrofit existing buildings, ensure all new builds are carbon neutral, promote electric vehicles and active travel, and reduce food waste and meat and dairy consumption.
How To Reduce Carbon Emissions at Home
Home emissions account for 22% of the UK’s carbon footprint. With over 25 million homes across the country, if everybody works on reducing their emissions, that footprint could be significantly reduced. Here are some steps you can take in and around the home to help bring down the national level of carbon emissions
-
- Turn the heating down. Heating accounts for one-third of the UK’s emissions. If everyone turned down their heating by one degree, emissions would fall by 3.5 million tonnes annually. Use a timer, thermostat or smart controls to keep your heating in check.
-
- Upgrade and insulate. Switching your heating from gas to electric or even a ground source heat pump will significantly reduce your footprint. Insulating pipes, walls and lofts ensures you maximise any heat you generate.
-
- Change the way you eat. A plant-based diet may reduce your annual footprint by 0.8 tonnes of CO2e. You can further help by lowering your fridge temperature to 5°C. Reduce food waste by shopping small and using the smell test on foods marked “Best Before.”
-
- Identify the biggest culprits. Air conditioners, washing machines and ovens can be among the worst household offenders. Switch to energy-efficient models and reduce use where possible. Living car-free can save you 2.4 tonnes of CO2e per year.
-
- Think green. Above all, keep carbon emissions and other environmental factors in mind when making decisions about your home — the things you buy, how you renovate and the routines you develop.
Finally, supporting businesses and politicians who forefront carbon emission reduction may be essential if humankind is to meet net-zero targets and keep Earth inhabitable. As 2030 approaches, efforts to improve efficiency are still outpaced by the spread of new construction projects, efficient or otherwise. The UN Environment Programme (UNEP) notes that the “increase in global gross floor area between 2015 and 2021 is the equivalent to the total land area covered in buildings in Germany, France, Italy and Netherlands” — the road to a hotter planet is paved with good intentions.
Methodology
To find out which cities have the best and worst carbon emissions from buildings in Britain, we analysed energy certificate data from GOV.uk for England and Wales and scottishepcregister.org.uk for Scotland.
We considered three different types of energy certificates:
-
- Domestic certificates (EPC) for residential buildings
-
- Non-domestic certificates (CEPC) for commercial buildings
-
- DEC certificates for public buildings (Note: Scotland lacked DEC data for public buildings)
We then recorded the certified Co2 emissions in kg/m2 per year for each building. This value is provided for domestic and non-domestic buildings. For public buildings, the value was calculated by summing up the three available sources of Co2 (emissions, electric, heating and renewables) and dividing it by the total floor area of the building in m2.
Lastly, we calculated the average Co2 emissions in kg/m2 for each type of building (home, commercial and public) for each city above 100k population.
For England and Wales, we also created a ranking that shows the weighted average of Co2 emissions per unit area across all three categories of buildings. Scottish cities were omitted from this ranking to make it a fair comparison, as they lacked data on public buildings.
This data study was completed in October 2024.


